Fake news on Twitter during the 2016 U.S. presidential election
Authors: Nir Grinberg, Kenneth Joseph, Lisa Friedland, Briony Swire-Thompson, David Lazer Venue: Science, Vol. 363, Issue 6425, pp. 374–378 (2019) — DOI
TL;DR
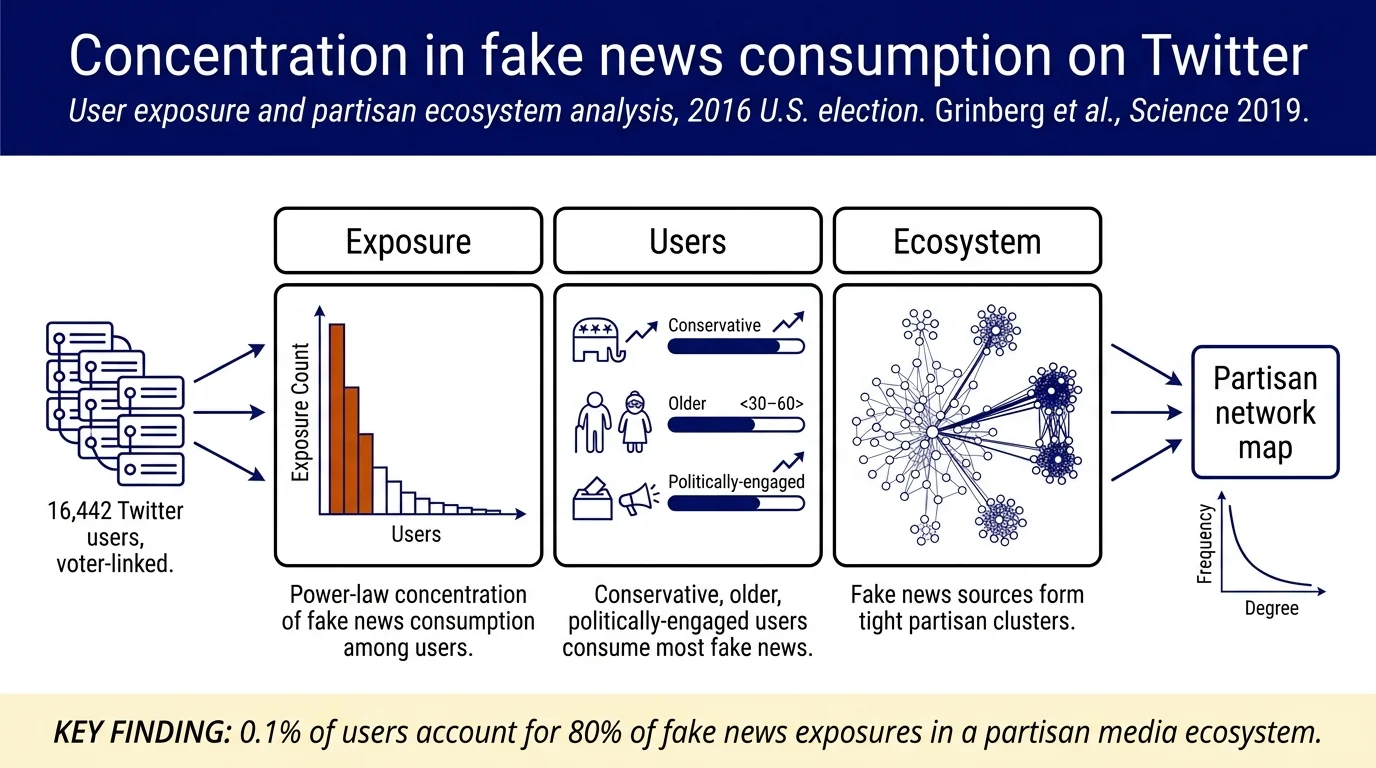
Fake news consumption on Twitter during the 2016 election was extremely concentrated: only 1% of users saw 80% of exposures, and 0.1% shared 80% of fake news. Conservative-leaning, older, highly politically engaged users drove most consumption. Despite this concentration, mainstream media still dominated overall political exposures even for extreme-right users.
Contributions
- First large-scale study of individual-level fake news exposure on Twitter linked to voter registration records.
- Quantified extreme concentration of fake news consumption: 0.1% of users account for 79.8% of fake news shares; 1% account for 80% of exposures.
- Identified that 5% of fake news sources account for >50% of exposures (within each classification tier).
- Characterized demographics and behavioral patterns of high fake-news consumers: conservative, older (positive correlation with age), high political engagement.
- Mapped fake news sources within the broader media ecosystem, showing they form a distinct cluster (Group 2) with high internal density consumed primarily by right-leaning users.
Method
Linked 16,442 Twitter accounts to public voter registration records to form a panel. Collected tweets from August 1 to December 6, 2016 during the 2016 election season. Estimated news feeds from random samples of followees' tweets. Classified content as political if it contained URLs to external web pages. Categorized fake news sources into three classes based on fact-checker lists and manual annotation: "black" (fabricated only; n=171), "red" (flawed editorial process; n=64), "orange" (uncertain; n=65). Assigned political affinity scores (extreme left, left, center, right, extreme right) based on similarity to registered Democrats/Republicans. Extracted co-exposure network structure to identify distinct media ecosystem groups.
Results
Prevalence and concentration: 5.0% of aggregate political exposures came from fake news sources; 6.7% of shared political URLs. Within each fake news category, 5% of sources accounted for >50% of exposures. Top seven fake news sources (all red/orange) accounted for >50% of all fake news exposures.
Who was exposed: Excluding outlier accounts, panel members averaged 204 potential exposures to fake news sources in the final month; if 5% were actually seen, ~10 actual exposures per user. Average 1.18% of political exposures came from fake news. Extreme partisan gap: 16.3% of right/extreme-right individuals had ≥5% fake news exposure vs. 2.5% on left. Age and political exposure volume were strongest predictors (10-fold increase in political exposures → 2× increase in proportion from fake news).
Who shared fake news: Among those who shared any political content, <5% on left/center shared fake news; 11% on right, 21% on extreme right shared fake news (p<0.0001). On congruent (politically matching) sources, sharing rates did not differ significantly between liberals/conservatives or fake/real sources; incongruent sources shared at significantly lower rates (p<0.01).
Media ecosystem: Four groups identified. Group 1 (mainstream outlets, 18.4% of sites): 72–86% of exposures across all groups, minimal fake news (3.6%). Group 2 (conservative/far-right): 68.8% fake news sources, high internal density; accounted for 64.2% of extreme-right users' non-Group-1 exposures vs. 8% for extreme left. 95.6% of multi-source fake-news consumers saw multiple fake news sources; 56.4% saw five or more.
Connections
- Related to The Spread of True and False News Online on longitudinal diffusion patterns; this work focuses on individual-level exposure concentration during a single election.
- Extends Social Media and Fake News in the 2016 Election survey estimates with direct Twitter measurement and social-network-linked analysis.
- Methodologically similar to The Role of User Profiles for Fake News Detection in characterizing user demographics of fake news consumers.
- Informs Election interference and information warfare research by quantifying the role of fake news at scale during a critical democratic moment.
- Related to Echo Chambers literature; findings somewhat contrary to echo chamber claims, as mainstream sources still dominated.
Notes
Strengths: Largest sample of individual-level exposure data linked to voter registration; panel representative of Twitter voters; multiple definitions of "fake news" (black/red/orange) allowing sensitivity analysis; clear demonstration of concentration patterns relevant to platform intervention design.
Limitations: Sample limited to Twitter; findings may not generalize to Facebook, TikTok, or other platforms. Some high-volume accounts likely cyborgs (partially automated); harder to distinguish intent. Exposure measured as potential (based on followee tweets), not actual viewing. Self-selection into political content; cannot distinguish causation in exposure–ideology relationship.
Open questions: Mechanisms driving older users' higher fake news exposure (cognitive decline vs. digital literacy vs. cohort effects vs. motivated reasoning). Role of bots and cyborgs beyond measurement artifacts. Generalizability across platforms and election cycles.