Social Media and Fake News in the 2016 Election
Authors: Hunt Allcott, Matthew Gentzkov
Venue: Journal of Economic Perspectives, Volume 31, Number 2, Spring 2017 — DOI
TL;DR
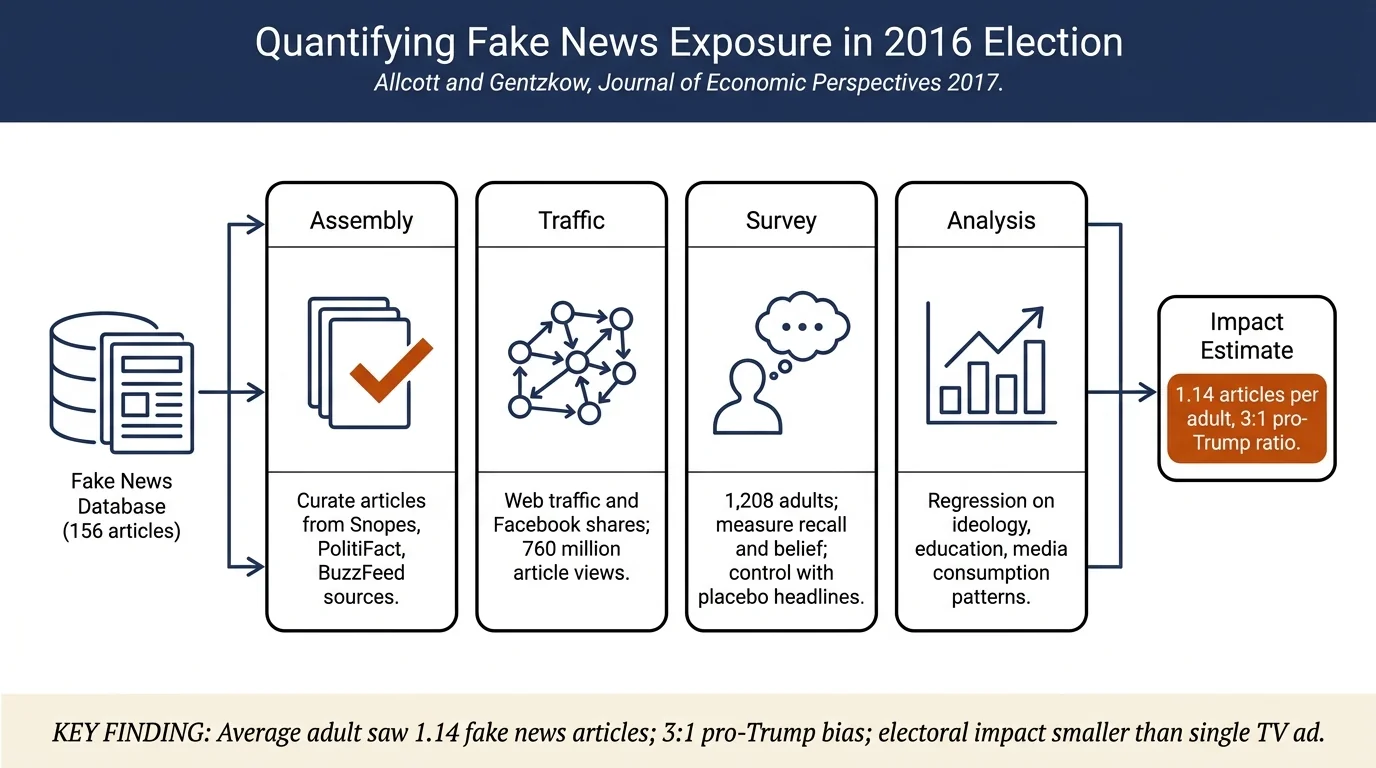
Allcott and Gentzkov provide the first comprehensive empirical evidence on fake news exposure during the 2016 US election. Drawing on a curated database of 156 fake news articles, web traffic data, and a post-election survey of 1,200 adults, they estimate the average American saw and remembered 1.14 fake news articles during the election period, with asymmetric partisan lean (3:1 pro-Trump to pro-Clinton). While this exposure is non-trivial, they argue its electoral impact is likely smaller than a single TV campaign advertisement, though the work raises important questions about the market dynamics and asymmetric political effects of misinformation.
Contributions
- Definition and measurement of fake news: Proposes "fake news" as intentionally false news articles (excluding satire, rumors, unintentional errors, and opinion). Distinguishes from related concepts like slant, bias, and conspiracy theories.
- Comprehensive empirical data: Assembled the first systematic database of election-related fake news stories from fact-checking sites (Snopes, PolitiFact, BuzzFeed), gathered traffic and engagement metrics, and fielded a nationally representative post-election survey.
- Exposure quantification: Estimates election-period fake news consumption: approximately 38 million Facebook shares of 156 fake articles, translating to 760 million article views, or roughly 1.14 articles read and remembered per American adult.
- Partisan asymmetry: Documents that pro-Trump fake articles (115 stories) were shared 30.3 million times vs. pro-Clinton articles (41 stories) shared 7.6 million times—a roughly 3:1 disparity.
- Individual-level analysis of belief: Uses regression analysis to identify predictors of whether people correctly identify headlines as true or false, finding education, media consumption patterns, and political polarization are significant factors.
- Economic framework: Sketches a supply-demand model of fake news markets based on Gentzkov, Shapiro, and Stone (2016), explaining why social media platforms lower the barrier to entry for low-quality, partisan, profit-driven news producers.
Method
The paper combines three empirical approaches:
Fake News Database: Scraped all fake news articles mentioned in three independent sources (Snopes, PolitiFact, and BuzzFeed lists of election-related false stories published in the three months before the 2016 election). The final database contains 156 articles, with 138 from Snopes, representing the largest list.
Web Traffic and Engagement: Used Alexa web traffic data to estimate the number of visits to fake news websites in the month before the election. For Facebook shares, they leveraged BuzzSumo (buzsumo.com) to count total shares per article as of December 1, 2016. Estimated a 20:1 ratio of page visits to shares, yielding exposure benchmarks.
Post-Election Survey: Conducted an online survey of 1,208 nationally representative US adults aged 18+ via SurveyMonkey (November 28, 2016). Survey design: respondents were asked whether they recalled seeing 15 randomly sampled news headlines (5 pro-Trump fake, 5 pro-Clinton fake, 3 verified true major headlines, 2 placebo fake headlines invented for control). For each headline, they reported whether they saw it before the election and whether they believed it. This design allowed estimation of both recall and belief separately, and inclusion of placebo headlines controlled for false recall.
Belief Regression: Used linear regression to identify predictors of whether individuals correctly identified headlines as true or false, including party affiliation (Democrat/Republican), media consumption patterns (education, daily media time, social media importance), ideological segregation in friend networks, and demographic variables (age, race, ethnicity).
Results
Exposure Estimates: - Database of 156 fake news articles accumulated 38 million Facebook shares by early December 2016. - Using a 20:1 visits-to-shares ratio, this translates to 760 million article views, or about 3 views per US adult. - Extrapolating from survey recall rates (8% remembered seeing a fake article, ~7% believed it), the average adult likely saw 1.14 fake news articles during the election period. - Web traffic data from Alexa confirms fake news sites derived 80% of traffic from social media, whereas top news sites get only 10%, underscoring the importance of social media distribution for fake news.
Partisan Bias: - 115 pro-Trump articles were shared 30.3 million times; 41 pro-Clinton articles were shared 7.6 million times—a 3:1 ratio favoring Trump. - Pro-Trump fake news comprised the majority of false stories on three fact-checking websites that Allcott and Gentzkov consulted.
Belief and Correction: - Democrats and Republicans were both about 15% more likely to believe ideologically aligned headlines than non-aligned headlines, supporting a "motivated reasoning" hypothesis. - Republicans were more likely to incorrectly believe false articles (Column 1, Table 1: coefficient of −0.024, meaning Republicans were ~2% less likely to correctly identify false articles as false). - Education strongly predicts correct belief: higher education was associated with ~1–2% increase in ability to identify false headlines correctly. - Survey respondents who reported social media as their "most important" news source were more likely to believe ideologically aligned false articles. - Ideologically segregated friend networks (measured by self-reported share of friends with opposite ideology) modestly increased the probability of believing ideologically aligned false articles.
Implication for Electoral Impact: - Authors cite a TV advertising study (Spenkuch and Toniatti 2016) showing one TV ad changes vote share by ~0.02 percentage points. - If a fake news article were comparably persuasive, and the average voter saw 1.14 of them, the estimated vote swing would be 0.02 × 1.14 ≈ 0.023 percentage points. - Trump's margin in key states (e.g., Pennsylvania) was much larger (0.7 percentage points), suggesting fake news alone was unlikely to have been decisive, though they acknowledge many caveats.
Connections
- Zhou & Zafarani (2020 survey) builds directly on this foundation with a comprehensive taxonomy of detection methods; cites Allcott & Gentzkov prominently.
- Vosoughi et al. (2018) provides complementary analysis of how false vs. true news spreads on Twitter, confirming asymmetry and higher velocity for false claims.
- Related to Political bias in fake news detection — both via partisan asymmetry in fake news production and via user-level ideological homophily effects.
- Related to Misinformation spread and diffusion — foundational for understanding social-media-driven distribution and engagement metrics.
- Related to Social-context-based fake news detection — demonstrates ideological segregation in friend networks as a moderator of fake news belief.
Notes
Strengths: - First paper to rigorously quantify fake news exposure in a major election using multiple converging methods (database, web traffic, survey). - Careful survey design (inclusion of placebo headlines, nationally representative weighting) improves credibility of recall and belief estimates. - Economic framing clarifies market incentives (low entry barriers on social media, profit motive vs. ideology). - Honest about limitations and caveats: database may be incomplete, estimated exposure may understate unmeasured stories, placebo/survey recall may not capture all exposure.
Weaknesses: - Database is incomplete—lists from fact-checkers may miss many false stories that went unvetted. Authors acknowledge this. - Exposure estimates rely on extrapolation from Facebook data; many articles were shared outside the platform (Reddit, Twitter, email, word-of-mouth). - The 20:1 visit-to-share ratio is rough. Traffic data from Alexa is known to be noisy. - Survey-based recall is subject to false recall, forgetting, and selection bias (SurveyMonkey panel is not fully representative despite weighting). - Causal interpretation of belief regressions is unclear—e.g., does education cause better discernment, or do educated people sort into less fake-news environments? - Electoral impact estimate assumes fake news articles have similar persuasiveness per view as TV ads—an unverified assumption.
Follow-ups: - Later work by others (Guess, Nyhan, & Reifler; Allcott, Gentzkow, & Yu; Levy) investigates the actual persuasiveness of exposure to fake news, with mixed results suggesting smaller effects than traditional media. - The partisan production asymmetry documented here remains a topic of ongoing research; later work explores whether it reflects demand-side preferences, supply-side incentives, or fact-checker bias. - The role of social media algorithms in amplifying polarized content has deepened since 2017, raising questions about whether observed exposure concentrations reflect algorithmic ranking or user preferences.