A first look at COVID-19 information and misinformation sharing on Twitter
Authors: Lisa Singh, Shweta Bansal, Leticia Bode, Ceren Budak, Guangqing Chi, Kornraphop Kawintiranon, Colton Padden, Rebecca Vanarsdall, Emily Viraga, Yanchen Wang
Venue: ArXiv, April 2020 — arxiv:2003.13907
TL;DR
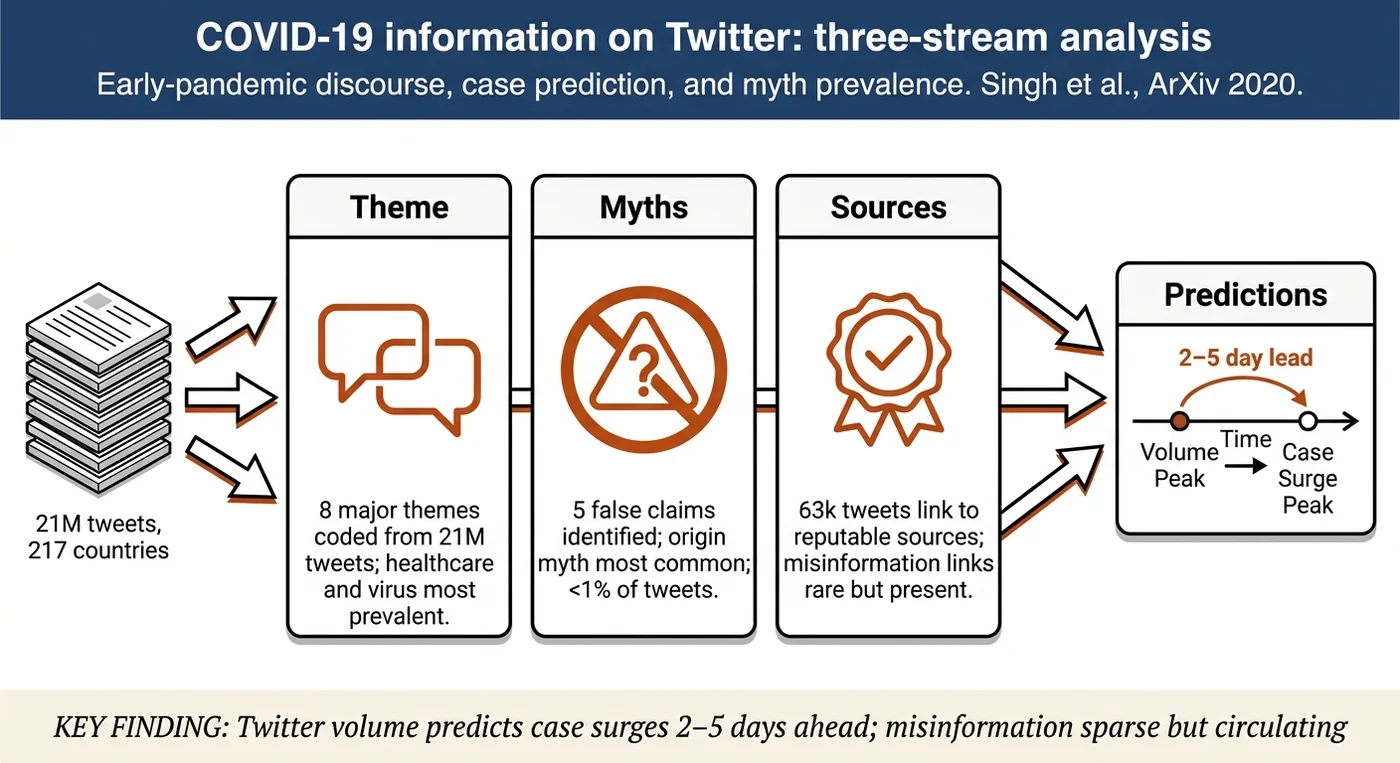
Early-pandemic analysis of 21 million COVID-19 tweets showing Twitter conversations predict case increases by 2–5 days; identifies five prevalent myths (origin, flu comparison, heat, home remedies, vaccine) accounting for ~0.6% of tweets; finds most shared URLs point to reputable sources (CDC, WHO) rather than misinformation sites, though absolute myth volume is concerning in a health crisis.
Contributions
- First empirical study of COVID-19 discourse on Twitter during early pandemic (Jan–Mar 2020) across 217 countries and 40+ languages
- Spatio-temporal correlation analysis showing Twitter conversation volume predicts confirmed COVID-19 case increases by 2–5 days depending on region (US: 2-day lead, Italy: 4-day lead, China: 4-day lead)
- Thematic analysis using manual coding identifying 8 major conversation themes: Healthcare/Illness/Virus (30%), Global Nature (29%), Information Providers (11%), Government Response, Individual Concerns/Strategies, Emotion, Economy, Social
- Systematic myth detection: identified 5 major COVID-19 myths by aggregating myth databases, applied word-phrase weighting to Twitter data, validated by hand (80% precision)
- Information quality assessment: distinguishes High-Quality Health Sources (HQHS, e.g., CDC, WHO) from Low-Quality/Misinformation Sources (LQMS), finds LQMS retweeted at lower rates but non-zero volume indicates real circulation risk
Method
Data: Twitter Streaming API collection Jan 16 – Mar 15, 2020 using COVID-19 hashtags. Final dataset: 21.4M tweets (2.8M original, 18.2M retweets, 456K quote tweets), geotagged subset used for location analysis (100% of geotagged English tweets with COVID-19 hashtags).
Conversation themes: Three researchers manually coded 537 frequent words (appearing ≥50k times) into 8 high-level themes using open coding. For each tweet, identified theme-representative words and proportionally assigned themes (majority-vote validation rule: ≥2/3 researchers agreed). ~80% of tweets assigned at least one theme.
Myth identification: Searched public myth databases ("Coronavirus Common Myths"), identified 10 recurring myths, ranked by search frequency and danger. Selected 5 for analysis: Origin of COVID-19, Flu Comparison, Heat Kills Disease, Home Remedies, Vaccine Development. For each myth, compiled word/phrase list from Google searches, assigned weights (e.g., "bioweapon" gets high weight for origin myth). Searched tweets for myth-associated phrases; hand-validated 250 tweets per category (80% precision, 100% of non-myths correctly rejected).
Information quality: Identified High-Quality Health Sources using CDC country list, national health agency websites, peer-reviewed medical journals, US government agencies. Identified Low-Quality/Misinformation Sources using NewsGuard list of dubious COVID-19 domains. Classified news articles (>1000 domains) by HQHS/LQMS link distribution. Twitter dataset: 351k tweets contain news links (13% of originals); 63k+ link to HQHS, <1k link to LQMS; assessed fraction of news articles linking to each source type.
Results
Conversation volume and timing: Tweet volume ramped significantly in late January 2024 (multiple outbreaks in Japan, South Korea, US). Peak volume reached ~3M tweets on Mar 11. Conversation volume led confirmed cases: Pearson correlations with 2-5 day lead showed highest correlation in US (r=0.78 at 2-day lead), Italy (r=0.88 at 4-day lead), China (r=0.80 at 5-day lead).
Language distribution: 57% of tweets in English, 11% Spanish, 6.5% French, 4.8% Italian. Language distribution for COVID-19 tweets differs from overall Twitter; underrepresented: Chinese (because Twitter is blocked in China; some use VPN), German (9.8% Twitter users), Indonesian, Arabic, Malay. Overrepresented on Twitter but less prevalent in COVID-19: Japanese, Thai.
Dominant themes: Healthcare/Illness/Virus most prevalent (30% of labeled content), followed by Global Nature (29%), Information Providers (11%). Other themes: Government Response, Individual Concerns/Strategies (protective measures, cleaning, masks), Emotion (fear, sadness, hope). Themes varied over time; English-speaking countries' tweet volume correlated with case emergence in their region (US cases late Feb → spike in US theme prevalence).
Myth prevalence: ~16,000 tweets (~0.6% of dataset) discuss one or more of the five identified myths. Origin of COVID-19 is most prevalent (>7k tweets), followed by Flu Comparison (~5k), Heat Kills Disease (~2k), Home Remedies (~1.5k), Vaccine Development (~500). Myth volume increased over study period but remains small relative to total conversation. Some tweets counter or debunk myths (not isolated here).
Information sources: 40.5% of original tweets include URLs; top domains: YouTube (78k), YouTube short (21k), Instagram (19k), NY Times (13k), BBC (10k). News articles predominantly link to reputable sources (228 news domains w/ ≥100 mentions; 175/178 link to HQHS ≥80% of time). Of 351k tweets with news links, 63k link to HQHS, 11.7k link to LQMS—ratio approximately 5.4:1 in favor of credible sources, but LQMS circulation still concerning in health crisis. Mixed-quality domains (both HQHS and LQMS links) exist but rare.
Connections
- Related to rumor detection social media via shared focus on early detection of false claims on social platforms
- Related to Health misinformation and COVID-19 Misinformation and Infodemic via empirical analysis of pandemic-specific myths
- Relates to information quality assessment work on distinguishing credible vs. dubious sources
- Cites and builds on misinformation health epidemiology as motivation for studying social media during health emergencies
Notes
Strengths: First rigorous empirical look at COVID-19 social discourse in early pandemic; multilingual, geographically diverse dataset; novel spatio-temporal lead-lag analysis suggesting Twitter as real-time disease surveillance proxy; transparent methodology for myth and theme identification with hand-validation; clear distinction between myth perpetuation vs. debunking.
Limitations: Twitter is biased sample (younger, urban, English-dominant in geotagged subset); measurement challenges acknowledged (non-representative population, API collection glitches Mar 13–14); myth detection is phrase-matching with hand validation, not semantic understanding—some tweets with myth keywords may not actually endorse the myth (e.g., debunking tweets). No causal claim for lead-lag relationship (social media may reflect rather than predict case discovery). Information quality assessment limited to explicit URL links, missing implicit sharing or misquotation of sources.
Open questions: Why does myth volume remain so low despite high concern in public health discussions? Do certain user subgroups disproportionately spread myths? How do myth narratives evolve over time as new cases are reported? Can real-time myth monitoring inform targeted fact-checking interventions?